 Catalogue GéoSAS
Type of resources
Available actions
Topics
Keywords
Contact for the resource
Provided by
Years
Formats
Representation types
Update frequencies
status
Service types
Scale
Resolution
-

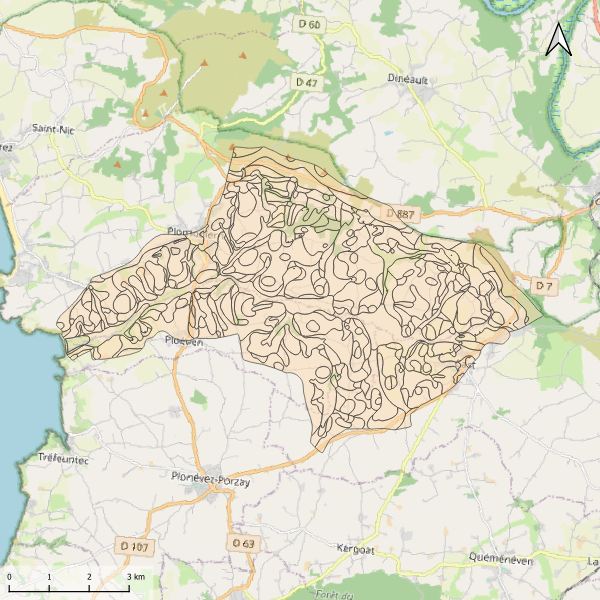
Les barrages sont à l’origine de modifications significatives du régime hydrologique, de la température de l’eau et des flux biologiques et biogéochimiques. C’est le cas des barrages de Vezins et de la Roche qui Boit, présents sur le cours principal de la Sélune, et d’autres plus petits obstacles qui fragmentent le bassin versant de la Sélune. Cette couche représente les barrages hydroélectriques de la Sélune, avec les batiments associés, en lien avec la production électrique. La géométrie de ces polygones est issue de plusieurs sources : BD Topo, OpenStreetMap (de 2019), complétée par photointerprétation. Des informations extraites du livre « Quand les rivières reprennent leur cours – Notes sur l’effacement de barrages et de seuils, sur la Sélune et ailleurs » ont été ajoutées pour décrire l'état (en service ou arasé), la nature et les caractérisques physiques de ces barrages.
-
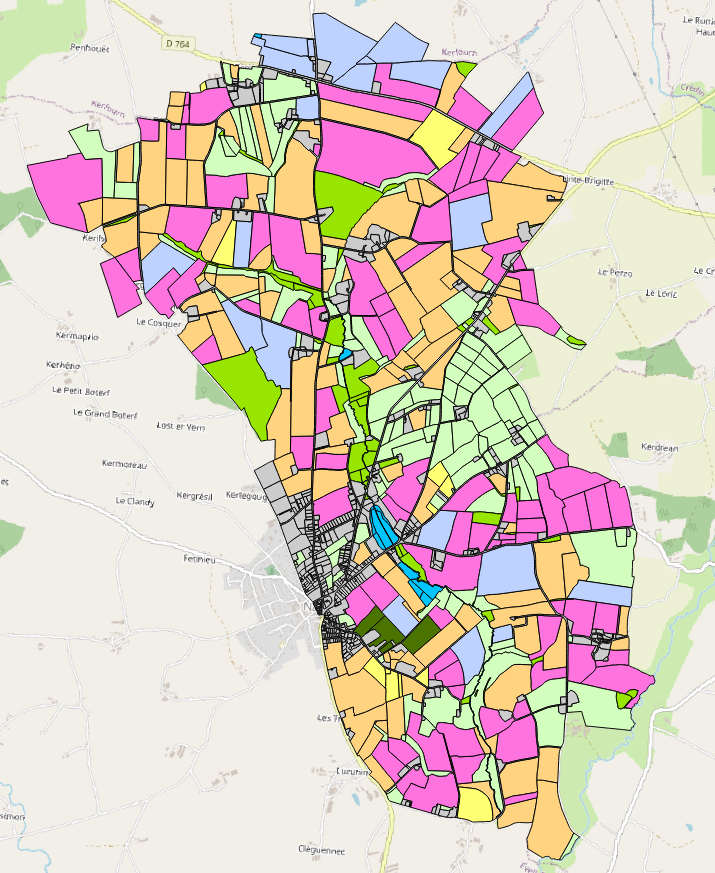
Occupation des sols 2006 du bassin versant du site de Naizin dans le Morbihan dans le cadre de l'Observatoire de Recherche en Environnement (ORE) AgrHyS d'INRAE. Le parcellaire est issu du cadastre de 2013. Les dessertes ont été redessinées à partir des orthophotos IGN de 2013 et le parcellaire a été découpé en fonction d’une zone tampon autour de ces dessertes. Les parcelles 2013 peuvent être découpées mais jamais regroupées. Toutes les entités géographiques élémentaires ont un identifiant unique sur l’ensemble des années. Champs de la table d’attribut : • ID_2006 : identifiant de la parcelle pour l’année 2006 • TYPE_06 : code principal de l’occupation des sols • S_TYPE_06 : code secondaire de l’occupation des sols • ID_ILOT : Identifiant numérique et non significatif par îlot du RPG 2006 • CODE_GROUP : code du groupe de cultures du RPG 2006 La nomenclature de ces codes des types et sous-types a été définie dans le programme ANR-12-AGRO-0005 MOSAIC : https://anr.fr/Projet-ANR-12-AGRO-0005. Leurs descriptions peuvent être télécharger ici : https://geosas.fr/metadata/ore/xls/legendes_osol_naizin.xlsx. Les occupations des sols sont issues des données par ilot du Registre Parcellaire Graphique (RPG) de l’année 2006. Les limites des parcelles ont été mises en concordance avec le parcellaire de 2013.
-
Carte pédologique de Kervijen au 1/25000. La codification correspond au code 4 critères des sols du Massif armoricain (voir ressources en ligne). Les champs de la table attributaire sont : - SUB : Matériau(x) parental(aux) à partir du(des)quel(s) se développe(nt) le sol - HYD : Classe d'hydromorphie, de 0 (sol bien drainé) à 9 (sol extrêmement hydromorphie) - TYPE : Développement de profil défini à partir de la succession des horizons - PROF : Profondeur du sol, classée de 1 (sols très épais) à 6 (sols superficiels) - CODE4C : code 4 critères issu de la concaténation des champs précédents. Les valeurs prises par les différents champs pour chaque entité sont détaillées dans la méthode 4 critères (voir ressources en ligne). - UTS : Numéro d'Unité Typologique de Sol issue du Référentiel Régional Pédologique de Bretagne.
-
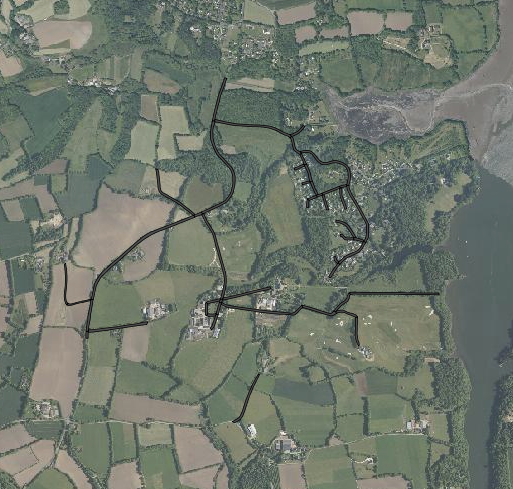
Représentation des routes et chemins du site d'étude INRA de Kerbernez. Les routes ont été tracées à partir de l'orthophotographie IGN 2011 et du scan 25 IGN 2011
-
Occupation des sols 2008 du bassin versant du site de Naizin dans le Morbihan dans le cadre de l'Observatoire de Recherche en Environnement (ORE) AgrHyS d'INRAE. Le parcellaire est issu du cadastre de 2013. Les dessertes ont été redessinées à partir des orthophotos IGN de 2013 et le parcellaire a été découpé en fonction d’une zone tampon autour de ces dessertes. Les parcelles 2013 peuvent être découpées mais jamais regroupées. Toutes les entités géographiques élémentaires ont un identifiant unique sur l’ensemble des années. Champs de la table d’attribut : • ID_2008 : identifiant de la parcelle pour l’année 2008 • TYPE_08 : code principal de l’occupation des sols • S_TYPE_08: code secondaire de l’occupation des sols • ID_ILOT : Identifiant numérique et non significatif par îlot du RPG 2008 • CODE_GROUP : code du groupe de cultures du RPG 2008 La nomenclature de ces codes des types et sous-types a été définie dans le programme ANR-12-AGRO-0005 MOSAIC : https://anr.fr/Projet-ANR-12-AGRO-0005. Leurs descriptions peuvent être télécharger ici : https://geosas.fr/metadata/ore/xls/legendes_osol_naizin.xlsx. Les occupations des sols sont issues des données par ilot du Registre Parcellaire Graphique (RPG) de l’année 2008. Les limites des parcelles ont été mises en concordance avec le parcellaire de 2013.
-
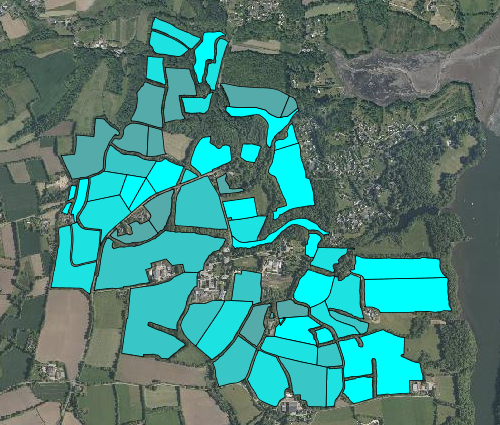
Carte du bilan en azote des parcelles du site d'étude INRA de Kerbernez. Le bilan azoté est renseigné de 1992 à 2005 et s'exprime en kg d'azote par hectare La couche vecteur a été crée à partir des données et des calculs de Laurent RUIZ et de la carte du découpage parcellaire réalisée par Samuel Abiven (ABIVEN. S., 2000)
-
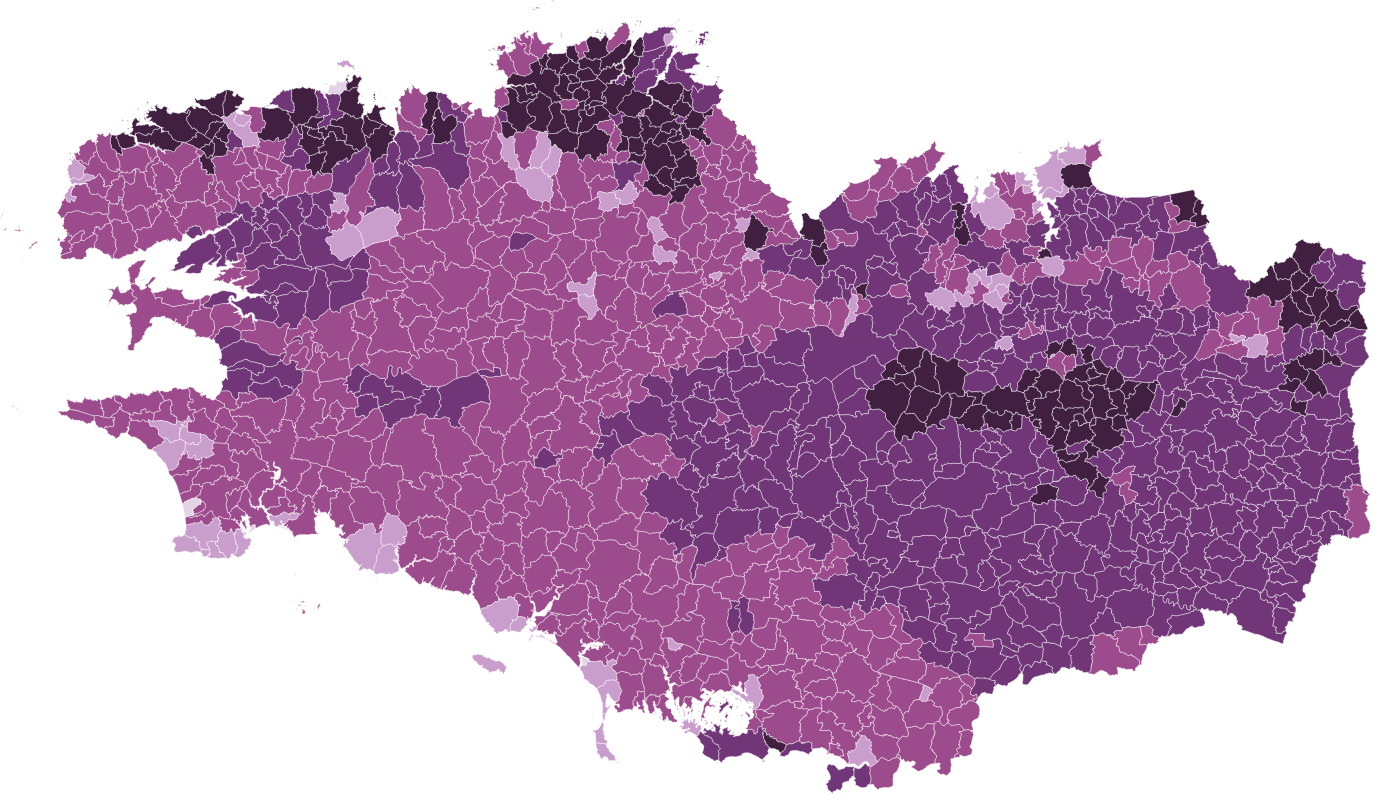
La proportion médiane de limon par commune des sols Bretagne a été estimée pour la région Bretagne à partir du Référentiel Régional Pédologique de Bretagne. Le vecteur est composé de six bandes, correspondant aux valeurs médiane de limon à six profondeurs standards : 0-15 cm, 5-15 cm, 15-30 cm, 30-60 cm, 60-100 cm et 100-200 cm. Les valeurs sont exprimées en pourcentage.
-
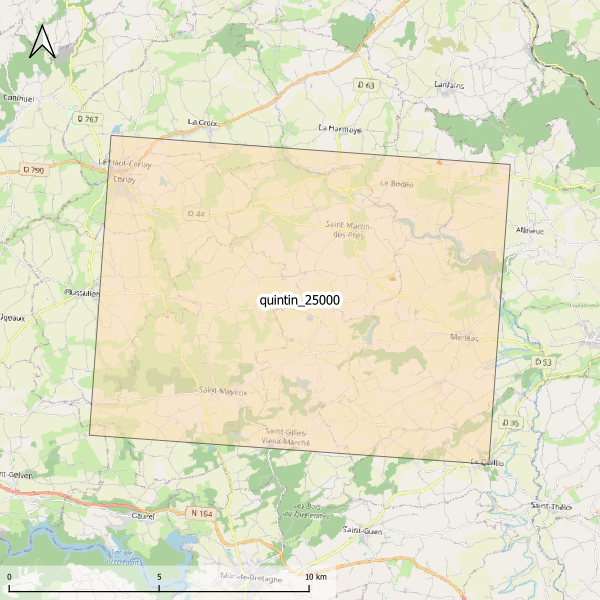
Emprise de la carte pédologique de Quintin au 1/25000. La donnée de base, au format vectoriel, n'est pas publiée.
-
Occupation des sols 2010 du bassin versant du site de Naizin dans le Morbihan dans le cadre de l'Observatoire de Recherche en Environnement (ORE) AgrHyS d'INRAE. Le parcellaire est issu du cadastre de 2013. Les dessertes ont été redessinées à partir des orthophotos IGN de 2013 et le parcellaire a été découpé en fonction d’une zone tampon autour de ces dessertes. Les parcelles 2013 peuvent être découpées mais jamais regroupées. Toutes les entités géographiques élémentaires ont un identifiant unique sur l’ensemble des années. Champs de la table d’attribut : • ID_2010 : identifiant de la parcelle pour l’année 2010 • TYPE_10 : code principal de l’occupation des sols • S_TYPE_10 : code secondaire de l’occupation des sols • NUM_ILOT : identifiant numérique et non significatif par îlot du RPG 2010 • CODE_GROUP : code des cultures de l’îlot regroupées du RPG 2010 La nomenclature de ces codes des types et sous-types a été définie dans le programme ANR-12-AGRO-0005 MOSAIC : https://anr.fr/Projet-ANR-12-AGRO-0005. Leurs descriptions peuvent être télécharger ici : https://geosas.fr/metadata/ore/xls/legendes_osol_naizin.xlsx. Les occupations des sols sont issues des données par ilot du Registre Parcellaire Graphique (RPG) de l’année 2010. Les limites des parcelles ont été mises en concordance avec le parcellaire de 2013.
-
Occupation des sols 2009 du bassin versant du site de Naizin dans le Morbihan dans le cadre de l'Observatoire de Recherche en Environnement (ORE) AgrHyS d'INRAE. Le parcellaire est issu du cadastre de 2013. Les dessertes ont été redessinées à partir des orthophotos IGN de 2013 et le parcellaire a été découpé en fonction d’une zone tampon autour de ces dessertes. Les parcelles 2013 peuvent être découpées mais jamais regroupées. Toutes les entités géographiques élémentaires ont un identifiant unique sur l’ensemble des années. Champs de la table d’attribut : • ID_2009 : identifiant de la parcelle pour l’année 2009 • TYPE_09 : code principal de l’occupation des sols • S_TYPE_09 : code secondaire de l’occupation des sols • ID_ILOT : Identifiant numérique et non significatif par îlot du RPG 2009 • CODE_GROUP : code du groupe de cultures du RPG 2009 La nomenclature de ces codes des types et sous-types a été définie dans le programme ANR-12-AGRO-0005 MOSAIC : https://anr.fr/Projet-ANR-12-AGRO-0005. Leurs descriptions peuvent être télécharger ici : https://geosas.fr/metadata/ore/xls/legendes_osol_naizin.xlsx. Les occupations des sols sont issues des données par ilot du Registre Parcellaire Graphique (RPG) de l’année 2009. Les limites des parcelles ont été mises en concordance avec le parcellaire de 2013.