 Catalogue GéoSAS
Type of resources
Available actions
Topics
Keywords
Contact for the resource
Provided by
Years
Formats
Representation types
Update frequencies
status
Service types
Scale
Resolution
-

Les barrages sont à l’origine de modifications significatives du régime hydrologique, de la température de l’eau et des flux biologiques et biogéochimiques. C’est le cas des barrages de Vezins et de la Roche qui Boit, présents sur le cours principal de la Sélune, et d’autres plus petits obstacles qui fragmentent le bassin versant de la Sélune. Cette couche représente les barrages hydroélectriques de la Sélune, avec les batiments associés, en lien avec la production électrique. La géométrie de ces polygones est issue de plusieurs sources : BD Topo, OpenStreetMap (de 2019), complétée par photointerprétation. Des informations extraites du livre « Quand les rivières reprennent leur cours – Notes sur l’effacement de barrages et de seuils, sur la Sélune et ailleurs » ont été ajoutées pour décrire l'état (en service ou arasé), la nature et les caractérisques physiques de ces barrages.
-
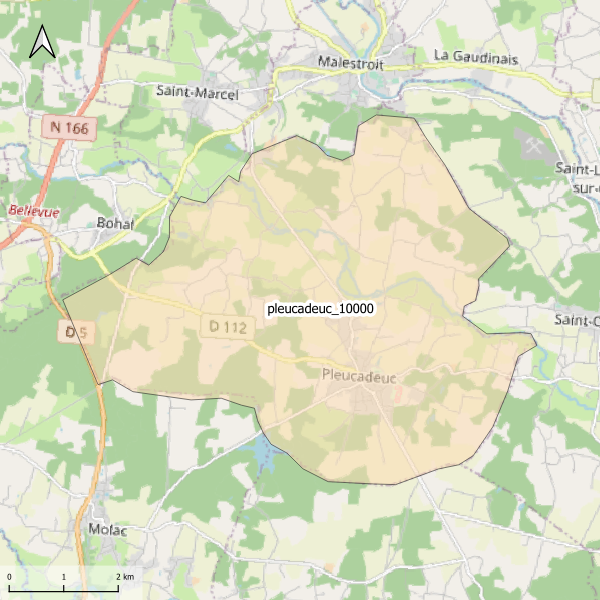
Emprise de la carte pédologique de Pleucadeuc au 1/10000. La donnée de base, au format image scannée, n'est pas publiée.
-
Carte des fossés du site d'étude INRA de Kervidy-Naizin. Cette carte a été levée en 2013. Une seule culture est renseignée cette année. La couche vecteur a été crée à partir des observations de terrain réalisées au mois de juin par Lucie CARRERA, Rémi DUPAS et Guillaume HUMBERT.
-
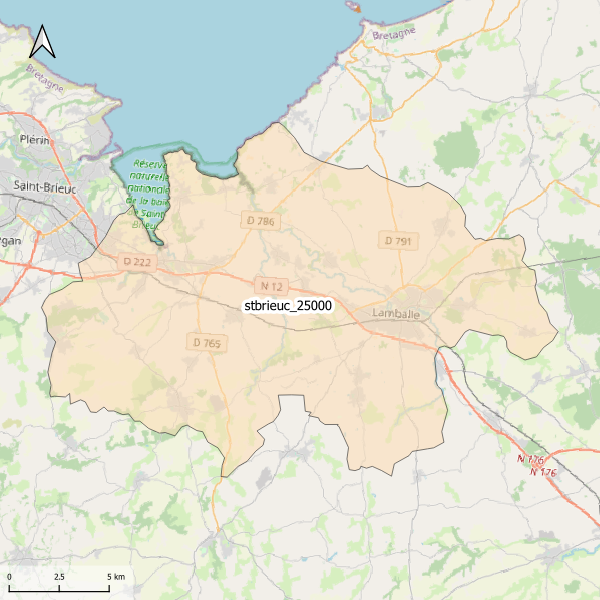
Emprise de la carte pédologique de Saint-Brieuc au 1/25000. La donnée de base, au format image scannée, n'est pas publiée.
-
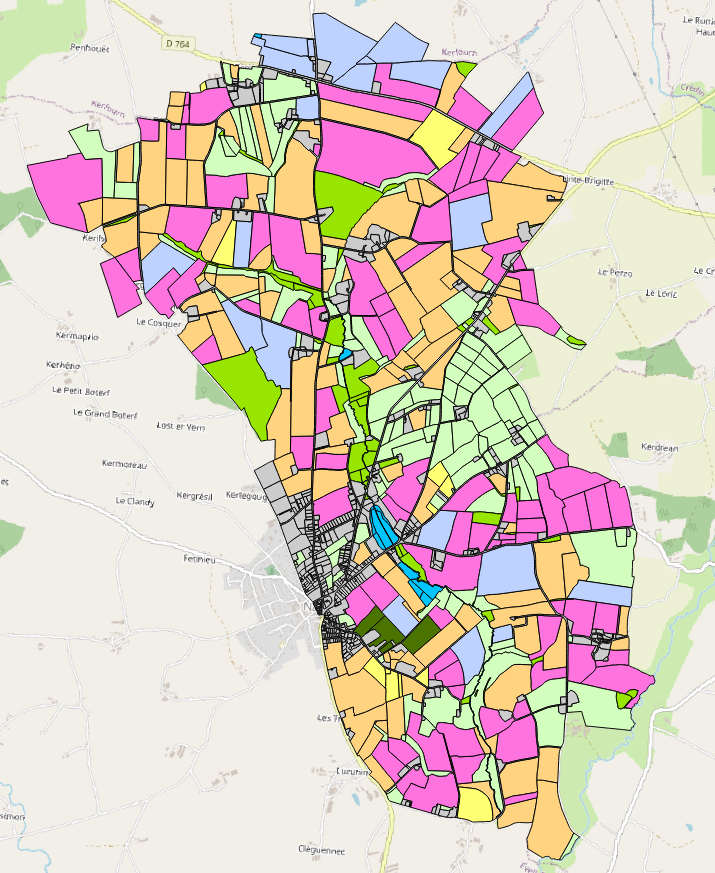
Occupation des sols 2015 du bassin versant du site de Naizin dans le Morbihan dans le cadre de l'Observatoire de Recherche en Environnement (ORE) AgrHyS d'INRAE. Le parcellaire est issu du cadastre de 2013. Les dessertes ont été redessinées à partir des orthophotos IGN de 2013 et le parcellaire a été découpé en fonction d’une zone tampon autour de ces dessertes. Les parcelles 2013 peuvent être découpées mais jamais regroupées. Toutes les entités géographiques élémentaires ont un identifiant unique sur l’ensemble des années. Champs de la table d’attribut : • ID_2015 : identifiant de la parcelle pour l’année 2015 • TYPE_15 : code principal de l’occupation des sols • S_TYPE_15 : code secondaire de l’occupation des sols • ID_PARCEL : Identifiant numérique et non significatif par parcelle du RPG 2015 • CODE_GROUP : code du groupe de cultures du RPG 2015 • CODE_CULTU : code du groupe de cultures majoritaire du RPG 2015 • CULTURE_D1 : code de la culture dérobée (culture intercalée entre 2 moissons de culture principale) sur la parcelle. • CULTURE_D2 : code de la seconde culture dérobée (culture intercalée entre 2 moissons de culture principale). La nomenclature de ces codes des types et sous-types a été définie dans le programme ANR-12-AGRO-0005 MOSAIC : https://anr.fr/Projet-ANR-12-AGRO-0005. Leurs descriptions peuvent être télécharger ici : https://geosas.fr/metadata/ore/xls/legendes_osol_naizin.xlsx. Les occupations des sols sont issues des données par parcelles du Registre Parcellaire Graphique (RPG) de l’année 2015. Les limites des parcelles ont été mises en concordance avec le parcellaire de 2013.
-
Occupation des sols 1999 du bassin versant du site de Naizin dans le Morbihan dans le cadre de l'Observatoire de Recherche en Environnement (ORE) AgrHyS d'INRAE. Le parcellaire est issu du cadastre de 2013. Les dessertes ont été redessinées à partir des orthophotos IGN de 2013 et le parcellaire a été découpé en fonction d’une zone tampon autour de ces dessertes. Les parcelles 2013 peuvent être découpées mais jamais regroupées. Toutes les entités géographiques élémentaires ont un identifiant unique sur l’ensemble des années. Champs de la table d’attribut : • ID_1999 : identifiant de la parcelle pour l’année 1999 • TYPE : code principal de l’occupation des sols • S_TYPE : code secondaire de l’occupation des sols La nomenclature de ces codes des types et sous-types a été définie dans le programme ANR-12-AGRO-0005 MOSAIC : https://anr.fr/Projet-ANR-12-AGRO-0005. Leurs descriptions peuvent être télécharger ici : https://geosas.fr/metadata/ore/xls/legendes_osol_naizin.xlsx. Les occupations des sols sont issues de photo-interprétation dans le cadre du programme CORMORAN (Cheverry et al., 1998). Les limites des parcelles ont été mises en concordance avec le parcellaire de 2013.
-
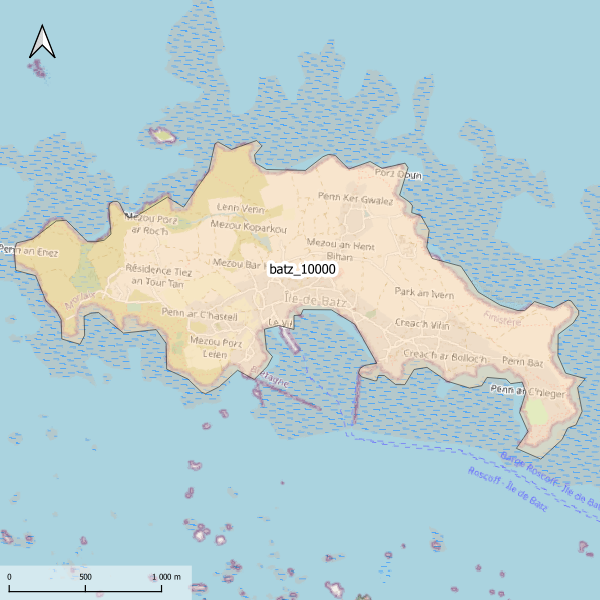
Emprise de la carte pédologique de l'île de Batz au 1/10000. La donnée de base, au format image scannée, n'est pas publiée.
-
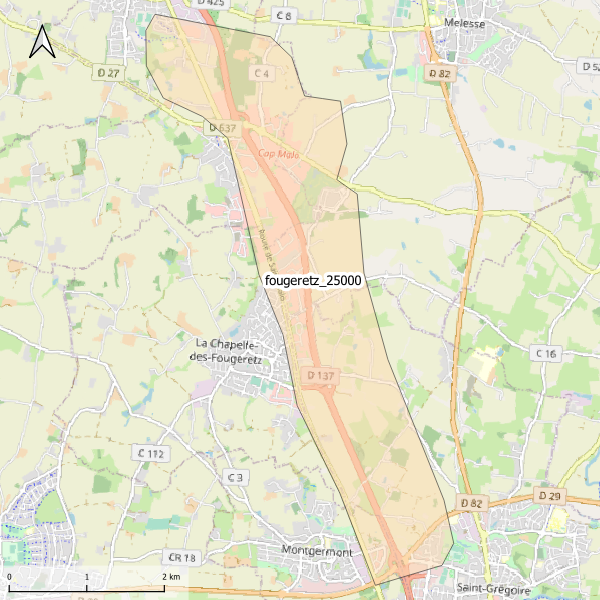
Emprise de la carte pédologique de La Chapelle-des-Fougeretz au 1/25000. La donnée de base, au format image scannée, n'est pas publiée.
-

Les macrophytes sont un ensemble de plantes aquatiques. Elles se situent à la base de la chaine alimentaire et peuvent fournir un habitat à de nombreuses autres espèces. Dans le cadre de l'observatoire Sélune ont été disposées des stations pilotes le long du cours principal de la Sélune, réparties de l’amont à l’aval des barrages hydroélectriques. Trois stations se situent dans les anciennes retenues des barrages, les deux autres, dites de référence, sont hors zone d'influence des anciens barrages (l'une étant en aval et l'autre en amont). Dans ces stations, les biocénoses aquatiques (incluant macroinvertébrés benthiques, biofilms, macrophytes...) sont suivies. Les paramètres suivis sont la composition spécifique et le recouvrement, sur 8 stations du cours principal situées à l’amont, à l’aval et sur les zones néo-lotiques des communautés de macrophytes. La fréquence du suivi consiste en une campagne annuelle pour les stations hors retenues (S0, S1 et S5) et deux campagnes annuelles (printemps/automne) pour les stations néo-lotiques (S2, S3.4, S4.1 et S6). Le protocole mis en œuvre est le protocole d’échantillonnage des macrophytes et bryophytes suivant la norme NF T90-395 (octobre 2003) qui définit l’IBMR. Les taxa sont prélevés pour être identifiés en laboratoire. Cette couche donne la localisation des secteurs d'étude utilisés dans le suivi des macrophytes ainsi que les campagnes réalisées et la mésologie identifiée sur ces différentes campagne.
-
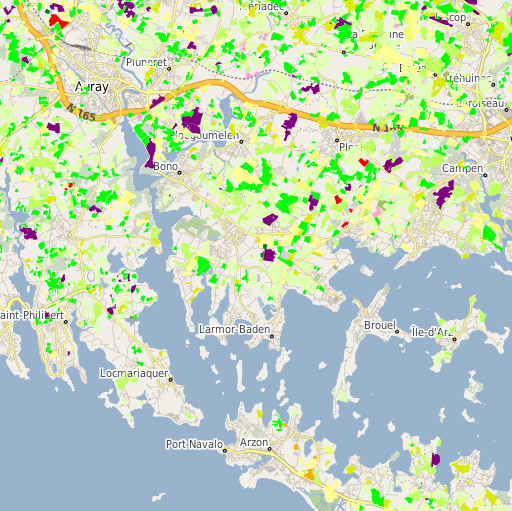
Registre Parcellaire Graphique anonymisé du Morbihan et rotations culturales de 2006 à 2014. La rotation culturale indiquée correspond à celle de la parcelle principale de chaque ilot déclaré à la PAC en 2014. Travail réalisé par l'UMR AGIR INRA et l'ODR INRA. Un identifiant non signifiant permet de retrouver les ilots d'une même exploitation.