dataset
Type of resources
Available actions
Topics
Keywords
Contact for the resource
Provided by
Years
Formats
Representation types
Update frequencies
status
Scale
Resolution
-

Les barrages sont à l’origine de modifications significatives du régime hydrologique, de la température de l’eau et des flux biologiques et biogéochimiques. C’est le cas des barrages de Vezins et de la Roche qui Boit, présents sur le cours principal de la Sélune, et d’autres plus petits obstacles qui fragmentent le bassin versant de la Sélune. Cette couche représente les barrages hydroélectriques de la Sélune, avec les batiments associés, en lien avec la production électrique. La géométrie de ces polygones est issue de plusieurs sources : BD Topo, OpenStreetMap (de 2019), complétée par photointerprétation. Des informations extraites du livre « Quand les rivières reprennent leur cours – Notes sur l’effacement de barrages et de seuils, sur la Sélune et ailleurs » ont été ajoutées pour décrire l'état (en service ou arasé), la nature et les caractérisques physiques de ces barrages.
-
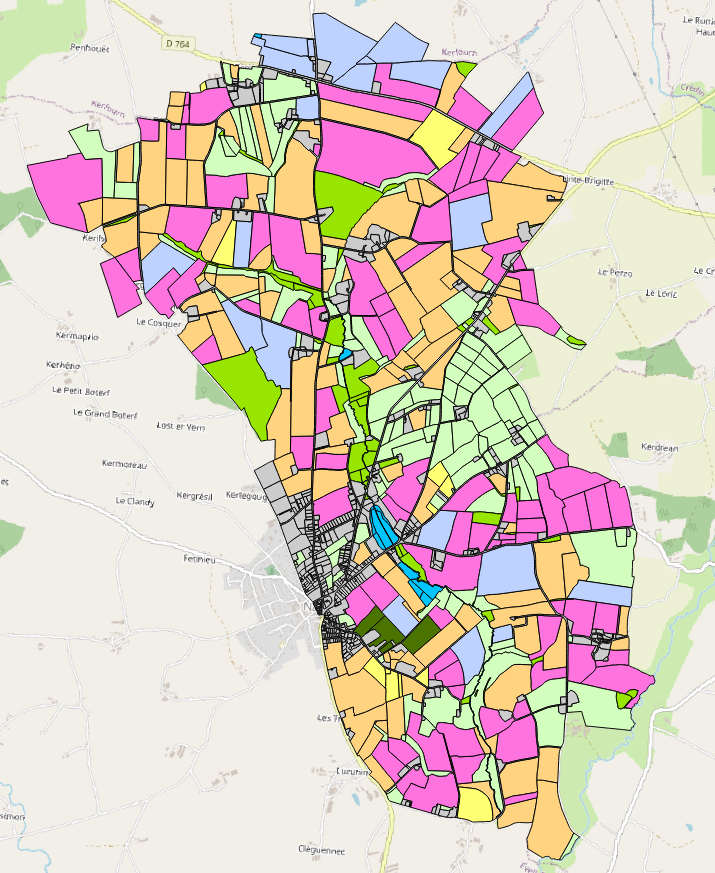
Occupation des sols 2018 du bassin versant du site de Naizin dans le Morbihan dans le cadre de l'Observatoire de Recherche en Environnement (ORE) AgrHyS d'INRAE. Le parcellaire est issu du cadastre de 2013. Les dessertes ont été redessinées à partir des orthophotos IGN de 2013 et le parcellaire a été découpé en fonction d’une zone tampon autour de ces dessertes. Les parcelles 2013 peuvent être découpées mais jamais regroupées. Toutes les entités géographiques élémentaires ont un identifiant unique sur l’ensemble des années. Champs de la table d’attribut : • ID_2018 : identifiant de la parcelle pour l’année 2018 • TYPE_18 : code principal de l’occupation des sols • S_TYPE_18 : code secondaire de l’occupation des sols • ID_PARCEL : Identifiant numérique et non significatif par parcelle du RPG 2018 • CODE_GROUP : code du groupe de cultures du RPG 2018 • CODE_CULTU : code du groupe de cultures majoritaire du RPG 2018 • CULTURE_D1 : code de la culture dérobée (culture intercalée entre 2 moissons de culture principale) sur la parcelle. • CULTURE_D2 : code de la seconde culture dérobée (culture intercalée entre 2 moissons de culture principale). La nomenclature de ces codes des types et sous-types a été définie dans le programme ANR-12-AGRO-0005 MOSAIC : https://anr.fr/Projet-ANR-12-AGRO-0005. Leurs descriptions peuvent être télécharger ici : https://geosas.fr/metadata/ore/xls/legendes_osol_naizin.xlsx. Les occupations des sols sont issues des données par parcelles du Registre Parcellaire Graphique (RPG) de l’année 2018. Les limites des parcelles ont été mises en concordance avec le parcellaire de 2013.
-
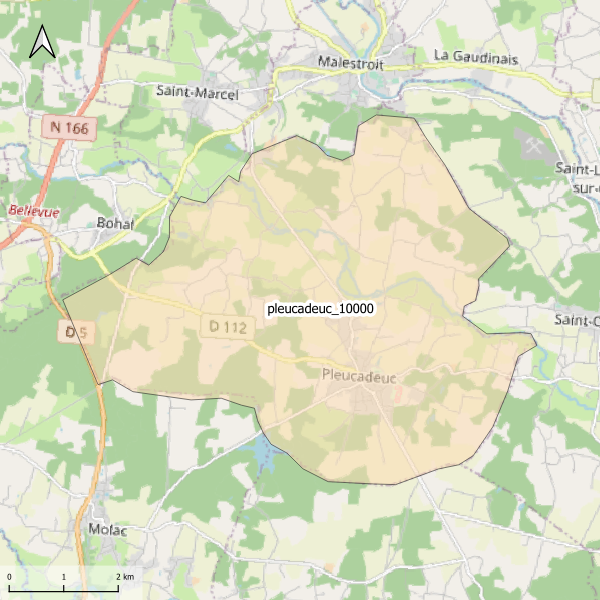
Emprise de la carte pédologique de Pleucadeuc au 1/10000. La donnée de base, au format image scannée, n'est pas publiée.
-
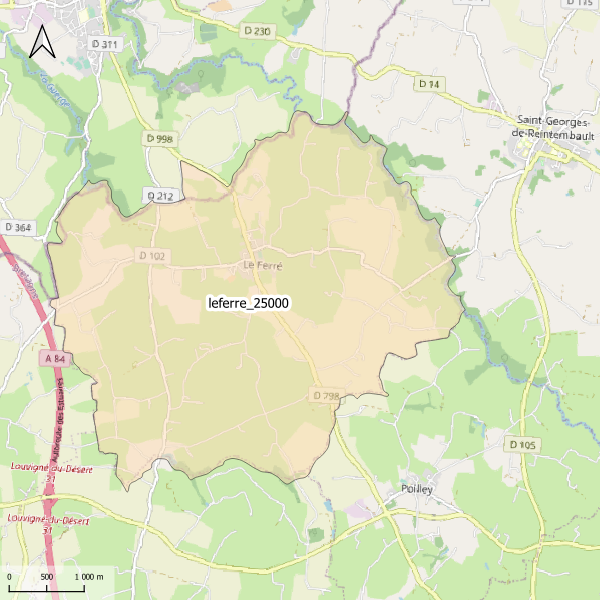
Emprise de la carte pédologique de Le Ferré au 1/25000. La donnée de base, au format image scannée, n'est pas publiée.
-

Occupation des sols 2015 du bassin versant du site de Naizin dans le Morbihan dans le cadre de l'Observatoire de Recherche en Environnement (ORE) AgrHyS d'INRAE. Le parcellaire est issu du cadastre de 2013. Les dessertes ont été redessinées à partir des orthophotos IGN de 2013 et le parcellaire a été découpé en fonction d’une zone tampon autour de ces dessertes. Les parcelles 2013 peuvent être découpées mais jamais regroupées. Toutes les entités géographiques élémentaires ont un identifiant unique sur l’ensemble des années. Champs de la table d’attribut : • ID_2015 : identifiant de la parcelle pour l’année 2015 • TYPE_15 : code principal de l’occupation des sols • S_TYPE_15 : code secondaire de l’occupation des sols • ID_PARCEL : Identifiant numérique et non significatif par parcelle du RPG 2015 • CODE_GROUP : code du groupe de cultures du RPG 2015 • CODE_CULTU : code du groupe de cultures majoritaire du RPG 2015 • CULTURE_D1 : code de la culture dérobée (culture intercalée entre 2 moissons de culture principale) sur la parcelle. • CULTURE_D2 : code de la seconde culture dérobée (culture intercalée entre 2 moissons de culture principale). La nomenclature de ces codes des types et sous-types a été définie dans le programme ANR-12-AGRO-0005 MOSAIC : https://anr.fr/Projet-ANR-12-AGRO-0005. Leurs descriptions peuvent être télécharger ici : https://geosas.fr/metadata/ore/xls/legendes_osol_naizin.xlsx. Les occupations des sols sont issues des données par parcelles du Registre Parcellaire Graphique (RPG) de l’année 2015. Les limites des parcelles ont été mises en concordance avec le parcellaire de 2013.
-
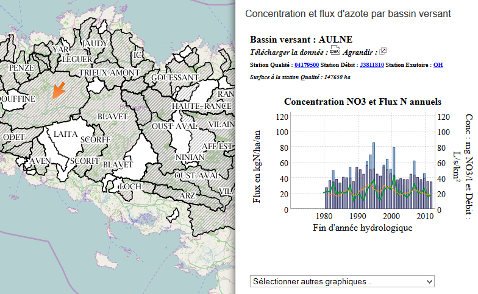
A une couche spatiale de bassins versants bretons, est intégré un outil de visualisation dynamique de graphes sur l’évolution de la qualité de l‘eau en nitrate. La couche d'information géographiques relative aux contours des bassins versants bretons est produite par traitement de Modèle Numérique de Terrain à l'aide du logiciel MNTSurf développé par Agrocampus Ouest – UMR SAS. La plupart des exutoires de ces bassins versants correspondent à des exutoires dits « à la mer » qui sont positionnés soit au niveau de barrages ou obstacles qui matérialisent la limite entre les eaux douces et les eaux marines salées, soit au niveau du point d’intersection entre le linéaire de la masse d’eau « cours d'eau » et les masses d’eau de « transition » ou « côtière » (source BD Carthage – masses d’eau définies dans le cadre de la Directive cadre sur l’eau DCE) . A l'intérieur des terres, les exutoires des sous-bassins versants correspondent généralement à des points de confluence du réseau hydrographique. Chacun de ces bassins ou sous-bassins versants possède une station référente de suivi de la qualité de l’eau (appelée station Qualité) au plus près de l’exutoire. Une grande partie de ces bassins est également équipée d’une station limnimétrique appelée station Débit. Pour chaque bassin versant disposant ainsi de chroniques de données de concentration en nitrate et de débit, des graphes de concentration et de flux d’azote sont générés automatiquement à l’aide d’un logiciel appelé « Macroflux ». Les représentations graphiques concernent les indicateurs suivants : hydraulicité, concentration journalière, concentration moyenne annuelle, flux annuel, flux spécifique moyen, flux pondéré par l’hydraulicité. La table attributaire de la couche spatiale contient un champ « Macroflux » qui pointe, pour chaque bassin versant, vers une application web proposant les graphes dynamiques précités. Exemple de graphe pour le bassin de l'Elorn : http://geowww.agrocampus-ouest.fr/cseb/dygraph_upsize.php?g=6&Varbv_id=61&VarBV=ELORN Ce travail est issu d’une étude lancée par le Conseil scientifique de l’environnement de Bretagne (CSEB) en 2008 en lien avec le Conseil régional et la DREAL Bretagne. Cette couche d’informations est intégrée dans un portail web cartographique développé par l’UMR SAS Agrocampus Ouest-INRA. Pour accéder à ce portail : https://geosas.fr/portails/?portail=cseb Pour en savoir plus sur les données et les calculs, voir la notice explicative : https://geosas.fr/metadata/pdf/notice_portailweb_cseb.pdf Pour maitriser le visualiseur de graphes, consulter le tutoriel vidéo : https://www.youtube.com/watch?v=7i-qM6NI6K8
-

Occupation des sols 2000 du bassin versant du site de Naizin dans le Morbihan dans le cadre de l'Observatoire de Recherche en Environnement (ORE) AgrHyS d'INRAE. Le parcellaire est issu du cadastre de 2013. Les dessertes ont été redessinées à partir des orthophotos IGN de 2013 et le parcellaire a été découpé en fonction d’une zone tampon autour de ces dessertes. Les parcelles 2013 peuvent être découpées mais jamais regroupées. Toutes les entités géographiques élémentaires ont un identifiant unique sur l’ensemble des années. Champs de la table d’attribut : • ID_2000 : identifiant de la parcelle pour l’année 2000 • TYPE : code principal de l’occupation des sols • S_TYPE : code secondaire de l’occupation des sols La nomenclature de ces codes des types et sous-types a été définie dans le programme ANR-12-AGRO-0005 MOSAIC : https://anr.fr/Projet-ANR-12-AGRO-0005. Leurs descriptions peuvent être télécharger ici : https://geosas.fr/metadata/ore/xls/legendes_osol_naizin.xlsx. Les occupations des sols sont issues de photo-interprétation dans le cadre du programme CORMORAN (Cheverry et al., 1998). Les limites des parcelles ont été mises en concordance avec le parcellaire de 2013.
-
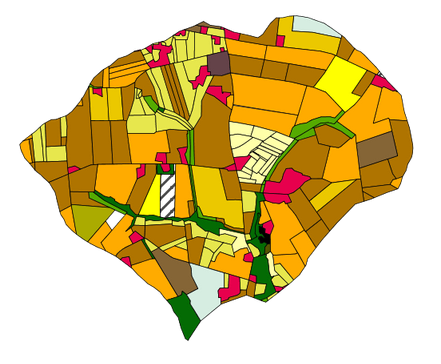
Carte des assolements du site d'étude INRA de Kervidy-Naizin. Les assolements concernent l'année 2013. Une seule culture est renseignée cette année. La couche vecteur a été crée à partir des observations de terrain réalisées au mois de juin par Lucie CARRERA, Rémi DUPAS et Guillaume HUMBERT.
-
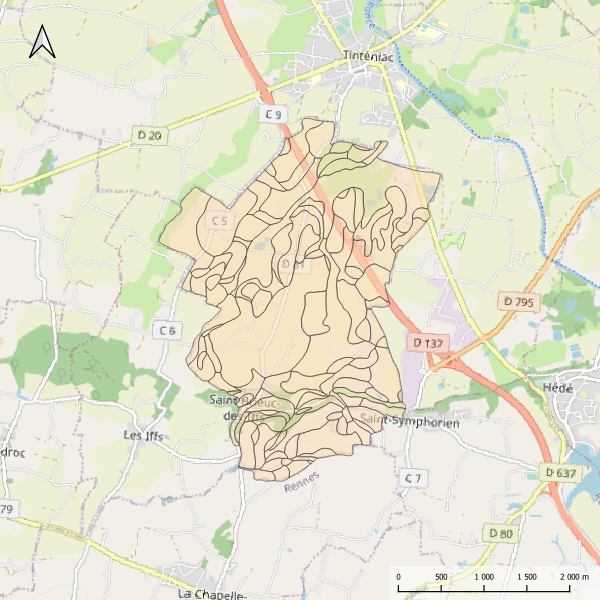
Carte pédologique de Saint-Brieuc-des-Iffs au 1/25000. La codification correspond au code 4 critères des sols du Massif armoricain (voir ressources en ligne). Les champs de la table attributaire sont : - SUB : Matériau(x) parental(ux) à partir du(des)quel(s) se développe le sol - HYD : Classe d'hydromorphie, de 0 (sol bien drainé) à 9 (sol extrêmement hydromorphie) - TYPE : Développement de profil défini à partir de la succession des horizons - PROF : Profondeur du sol, classée de 1 (sols très épais) à 6 (sols superficiels) - CODE4C : code 4 critères issu de la concaténation des champs précédents. Les valeurs prises par les différents champs pour chaque entité sont détaillées dans la méthode 4 critères (voir ressources en ligne). - UTS : Numéro d'Unité Typologique de Sol issue du Référentiel Régional Pédologique de Bretagne. Les numéros des UTS ne sont pas renseignés.
-
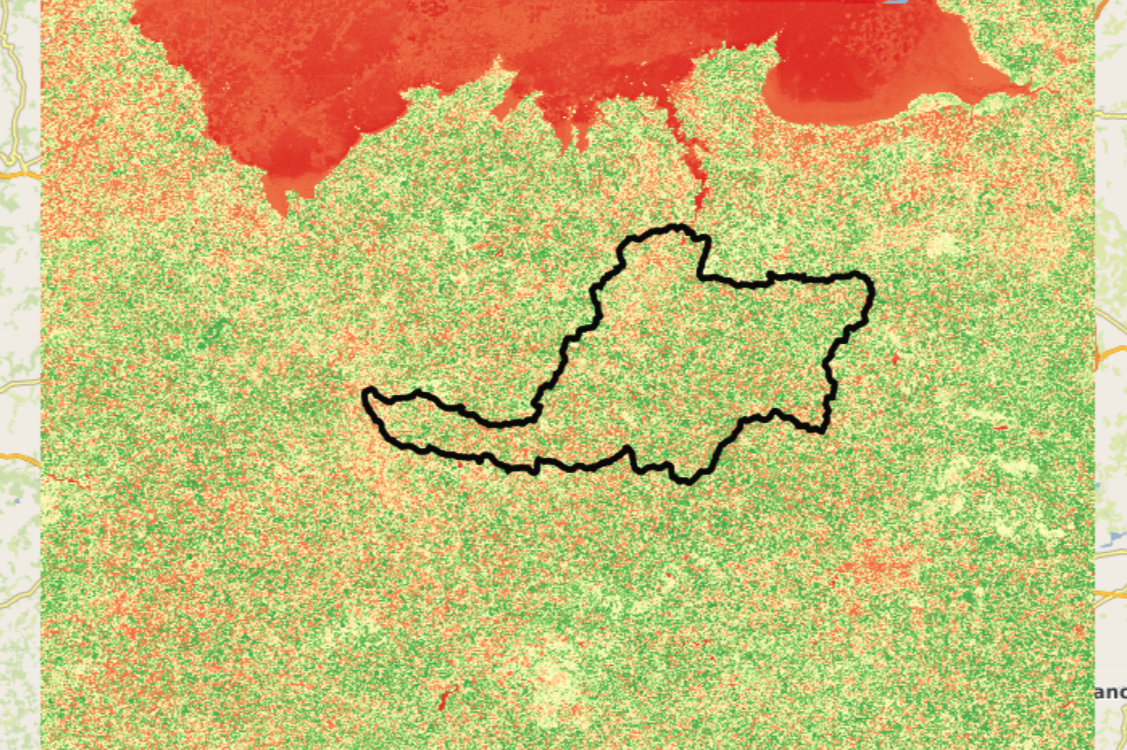
Cette carte illustre la moyenne annuelle de l'indice de végétation par différence normalisée (NDVI) pour l'année 2020 dans une région de Bretagne, avec une attention particulière portée au bassin versant de la Rance (délimité en noir). Le NDVI, calculé à partir de données satellitaires, est un indicateur clé pour évaluer la densité et la santé de la végétation. Les couleurs varient des zones rouges (faible couverture végétale ou sols nus) aux zones vertes (végétation dense et en bonne santé). Cette analyse fournit une vue d'ensemble des dynamiques écologiques en 2020 et constitue une base précieuse pour la gestion des écosystèmes, l'agriculture et la conservation dans cette région.
 Catalogue GéoSAS