notPlanned
Type of resources
Available actions
Topics
Keywords
Contact for the resource
Provided by
Years
Formats
Representation types
Update frequencies
status
Service types
Scale
Resolution
-
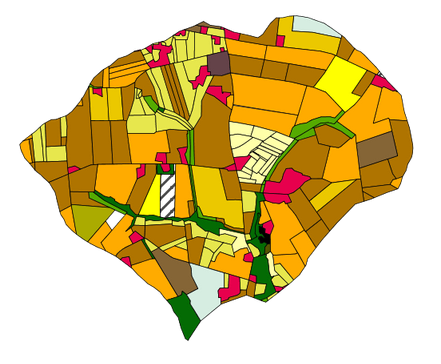
Carte des assolements du site d'étude INRA de Kervidy-Naizin. Les assolements concernent l'année 2013. Une seule culture est renseignée cette année. La couche vecteur a été crée à partir des observations de terrain réalisées au mois de juin par Lucie CARRERA, Rémi DUPAS et Guillaume HUMBERT.
-
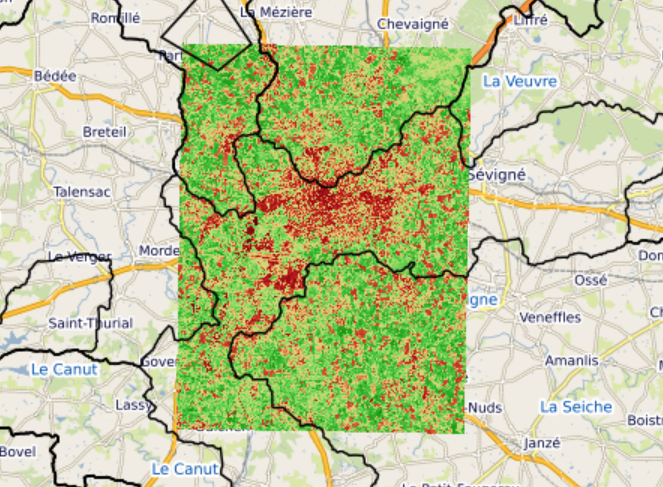
Superposition de la délimitation des Bassins Versants de Bretagne avec l'indice de végétation NDVI découpé sur la ville de Rennes. Les Bassins Versants de l'étude CSEB résume la localisation et la délimitation de l'ensemble des bassins versants présent en Bretagne. Cette donnée est disponible en libre service sur GéoBretagne. Le NDVI calculé sur Rennes est basé sur un image Sentinel-2 récupéré sur SentinelHub.
-
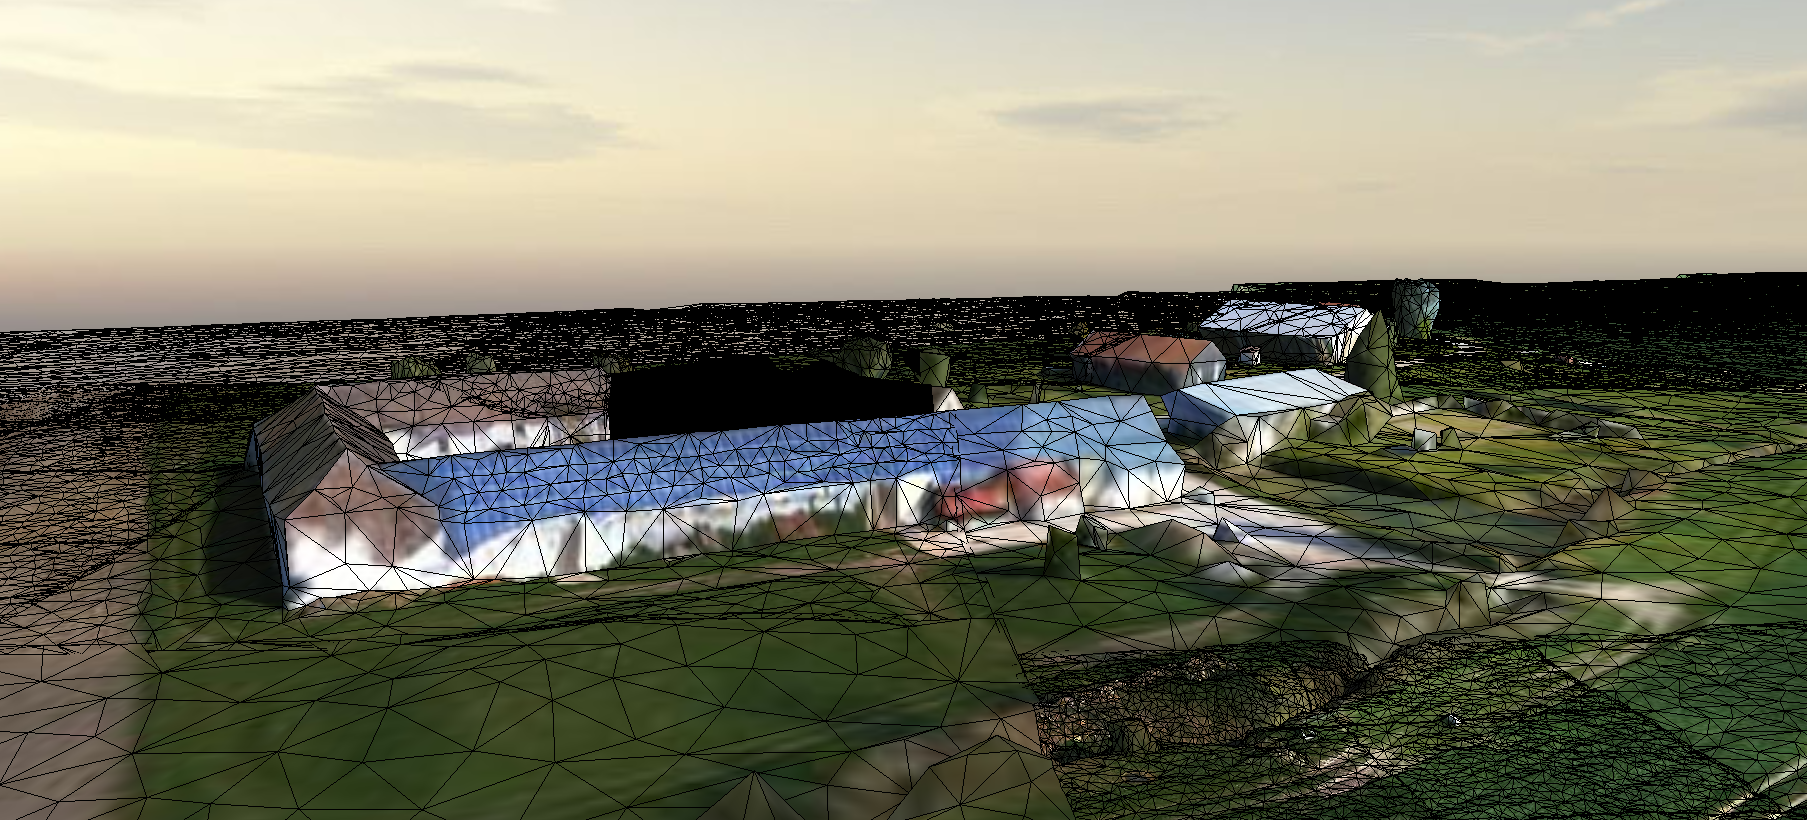
Survol d'une partie du Ru des Effervettes,en limite des communes de Nangis et Fontains, dans le département de la Seine et Marne. Les données ont été acquises par drone anafiet restituées en un maillaige tridimentionnel (mesh).
-
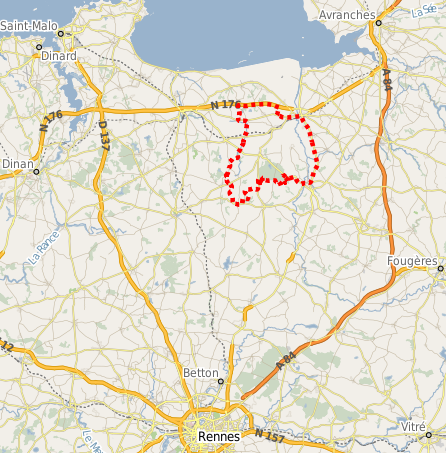
L’entité bocagère de la Zone Atelier Armorique (ZAAR) est située au niveau du canton de Pleine-Fougères (depuis 1993). La zone bocagère est caractérisée par un gradient paysager allant d’un bocage dense avec des parcelles petites bordées de haies à un bocage lâche. Les haies bordant les parcelles sont le plus souvent constituées d’arbres émondés en ragosses, de chênes avec parfois quelques châtaigniers émondés et des chênes en haut jet, mais aussi de cépées de châtaigniers. Depuis 2005, en raison de l’introduction de conditions de protection de l’environnement dans la Politique Agricole Commune, la plupart des cours d’eau sont bordés de bandes enherbées.
-

Service de visualisation cartographique (WMS) de Sols de Bretagne [GéoSAS]
-
Service de visualisation cartographique (WMS) de l'Observatoire de Recherche en Environnement (ORE) AgrHys de l'INRA. GéoSAS, portail de l'information géographique de l'Unité Mixte de Recherche, Sol Agro et hydrosystèmes, Spatialisation. UMR 1069 SAS INRAE - L'Institut Agro Rennes-Angers
-
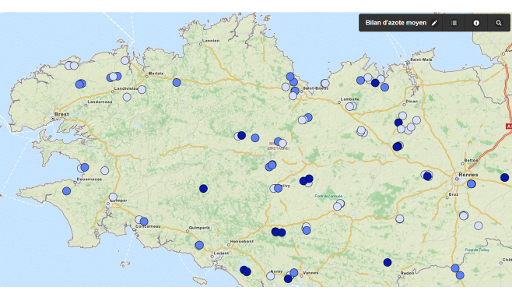
Le projet Mh est un projet de Recherche et Développement dont les objectifs sont (i) de hiérarchiser les déterminants de la minéralisation de l’azote des matières organiques humifiées du sol (MOS) (climat, sol, pratiques culturales), et (ii) d’améliorer in fine la prévision de la minéralisation de l’azote des MOS dans les outils de raisonnement de la fertilisation. Ce projet de recherche-développement s’inscrit dans le cadre de la reconquête de la qualité de l’eau en Bretagne, et il est financé par l’Agence de l’Eau Loire Bretagne (AELB), le Conseil Régional de Bretagne, les Conseils Généraux du Finistère, des Côtes d’Armor et du Morbihan et la DRAAF. La coordination du programme est assurée par l’AELB, sa maîtrise d’œuvre par la Chambre Régionale d’Agriculture de Bretagne (CRAB), et sa conduite scientifique par l’INRA UMR SAS. Le projet est fondé sur un réseau de 141 parcelles réparties sur l’ensemble de la Bretagne, et a été suivi pendant 5 ans, de 2010 à fin 2014. La minéralisation a été quantifiée par la mesure des composantes du bilan azoté d’une culture de maïs non fertilisée (rendement et N absorbé par la culture, quantités de N minéral du sol au printemps et à l’automne, lixiviation estimée par approche modèle (STICS)). Une importante base de données sur les sols a été constituée pour expliquer la variabilité de la minéralisation, avec des mesures physiques, chimiques, biologiques et en spectroscopie infra rouge.
-
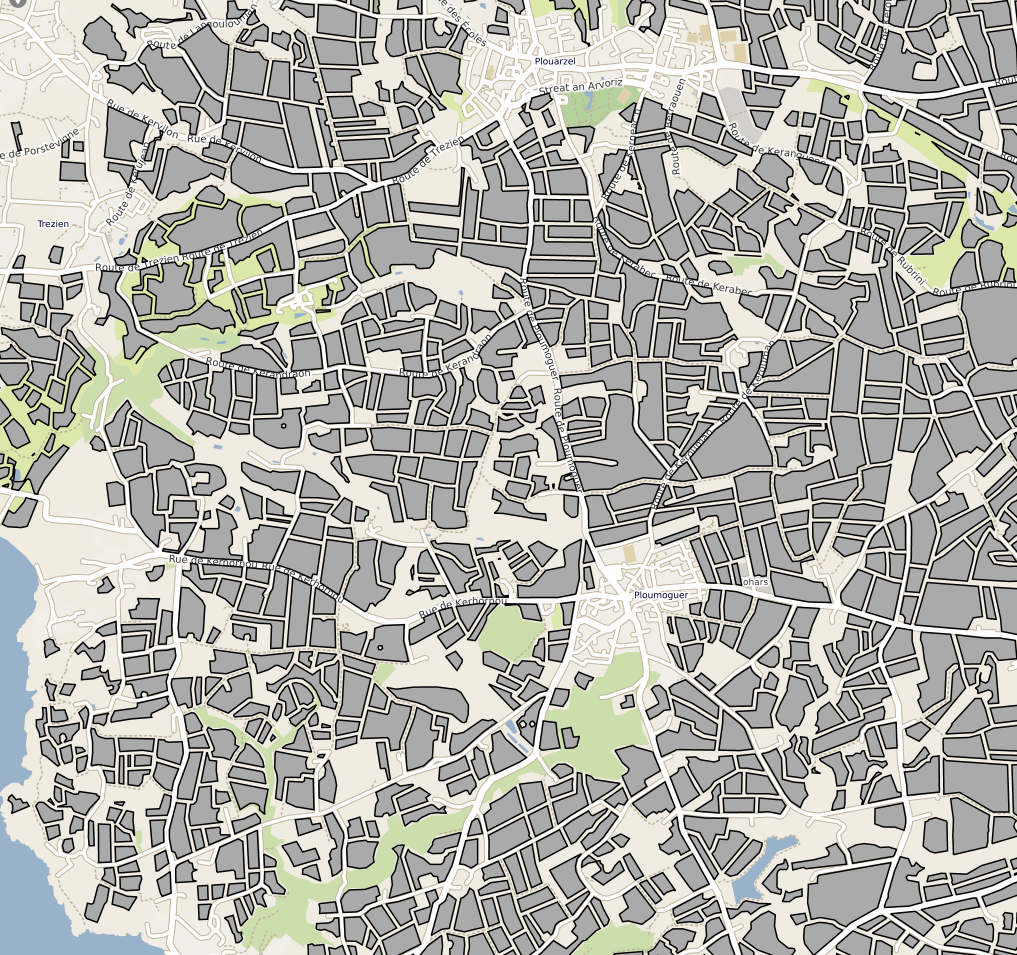
Parcelles cultivées résultant de la compilation des Référentiels Parcellaires Graphiques (RPG) de 2017 et 2019. La table attributaire contient un lien vers la série temporelle de l'humidité de surfacede la parcelle depuis 2017.
-
Le territoire régional est composé de taches urbaines de différentes tailles et formes, distribuées de manière variée. Les espaces urbains sont reliés les uns aux autres par le réseau routier, en particulier le réseau composé des routes primaires et secondaires. Cet espace urbain et routier ainsi composé est fortement artificialisé avec une forte composante d’imperméabilisation qui perdure au fil du temps. La dynamique spatiale et temporelle de cet espace peut être évaluée par les surfaces qui deviennent artificialisées, par la consommation des surfaces interstitielles, généralement agricoles ou naturelles. Ces surfaces à faible imperméabilisation, moins artificialisées, sont ainsi des îlots séparés les uns des autres par la trame urbaine et routière. Ces ilots sont de tailles variées et composent une structure fragmentée.Cet indice prend la forme d'une taille effective de maille, à savoir une grandeur qui exprime « la probabilité que deux points choisis au hasard dans un territoire [...] ne soient pas séparés par des obstacles tels que les voies de communication ou des zones bâties » (J. Jaeger, 2007).
-
Le coefficient de dispersion représente le rapport entre la surface des espaces artificialisés (taches urbaines) morcelés, définis ici pour une emprise inférieure à 3 hectares, et celle des espaces artificialisés denses supérieurs ou égales à 3 hectares.Cet indicateur a été calculé par canton et pour les années 2015 à 2019.
 Catalogue GéoSAS