 Catalogue GéoSAS

Type of resources
Available actions
Topics
Keywords
Contact for the resource
Provided by
Years
Formats
Representation types
Update frequencies
status
Scale
Resolution
-
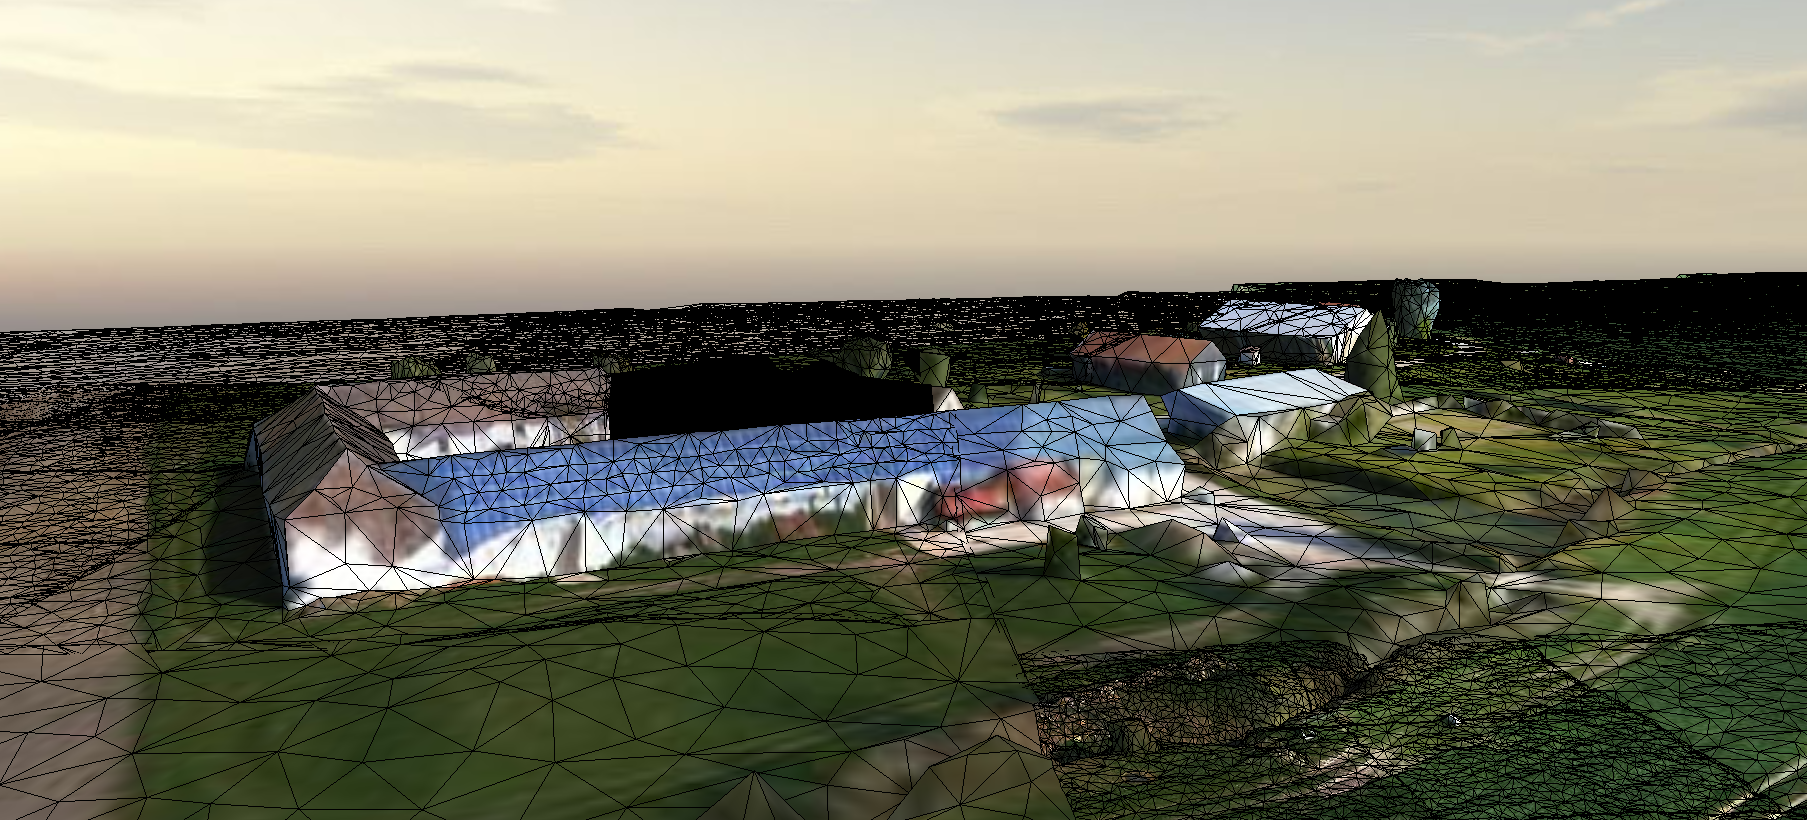
Survol d'une partie du Ru des Effervettes,en limite des communes de Nangis et Fontains, dans le département de la Seine et Marne. Les données ont été acquises par drone anafiet restituées en un maillaige tridimentionnel (mesh).
-

"Langage de programmation informatique (Ocelet) et son environnement associé (Ocelet Modeling Plateform) dédiés à la modélisation & à la simulation de dynamiques spatiales & paysagèresOcelet permet aux chercheurs dans les domaines de l’environnement, l’agriculture, l’épidémiologie, de produire des modèles cartographiques multifactoriels mettant en évidence l’impact de décisions ou l’effet d’évolutions des facteurs d’influence. Il est utilisé pour intégrer différentes formes de représentation de l'espace au sein d'un même modèle afin de simuler des scenarii de dynamiques spatiales. Il est en cela un excellent outil pour l'étude de l'évolution de paysages ou de problématiques environnementales. CaractéristiquesGère plusieurs échelles spatiales et temporelles Intègre diverses formes d’information géographique et un grand nombre d’entités/processus Produit des cartes dynamiques représentant l’évolution de phénomènesServices associésExpertise pour intégrer le langage Ocelet dans les projets de modélisation prédictive en appui à la gestion du territoire Appui au développement de modèles de simulation Formation à l’usage du langage (cf. catalogue de formations du Cirad)"
-

"Le CES “Humidité du sol à très haute résolution spatiale”propose de nouvelles cartes d’humidité du sol sur la région Occitanie à l’échelle sub-parcellaire élaborées tous les 6 jours de septembre 2017 à mars 2018.Les données utilisées sont issues des séries d’images Copernicus radar Sentinelle 1 et optique Sentinelle 2. L’algorithme d’inversion du signal radar utilise les réseaux de neurones. Il est appliqué sur les parcelles agricoles (avec ou sans végétation) extraites de la carte d’occupation des sols 2016 élaborée par le CES Occupation des sols de Theia (Jordi Inglada et al.)."
-

"Modern Earth Observation systems provide huge amount of data from different sensors at different temporal, spatialand spectral resolutions. Such amount of information is commonly represented by means of multispectral imagery and, due to its complexity, it requires new techniques and method to be correctly exploited to extract valuable knowledge.Recently, data science and, in particular, machine (and deep) learning algorithms have demonstrated their ability to cope with image and signal analysis providing cutting-edge results. Multiple data science challenges were already launched using satellite imagery (i.e. building footprints, road networks, iceberg detection, etc…) but crucial open questions remain unsolved (i.e. biodiversity monitoring, urban mapping, deforestation tracking and food risk prevention, triaging disaster zones, etc..). We are at the beginning of a new era for the analysis of Earth Observation data (EOD) where one of the main question is how to leverage the complementarity and the diversity of the different Earth Observation systems to answer important social challenges and monitor changes on the Earth Surface.The MDL4EO team (Machine and Deep Learning for Earth Observation) at the UMR TETIS (Montpellier, France) has the objective to scientifically contribute to this new era providing AI methods and algorithms to extract valuable knowledge from modern Earth Observation Data. The amount of data being collected by remote sensors is accelerating rapidly and we cannot manage them manually, this is why machine/deep learning lends itself well to remote sensing. More in detail, some of the research questions of the MDL4EO team are the follows:How to intelligently exploit Time Series of Satellite Images to leverage temporal dynamics How to combine/fusion together multi spectral/temporal/resolution/sensor information with the objective to add value to the information thanks to the combination of multi source How to transfer knowledge from different geographical Area: transfer land cover classification model from one site (i.e. France) to another one geographically distant (i.e. Africa). It’s time to fill the gap between Remote Sensing and AI. MDL4EO is working on that direction bringing together different expertises: Data Science, Computer Vision, Machine Learning, Remote Sensing and Geoinformatics."
-

A very high spatial resolution Land Use and Land Cover map was produced for the greater Marino watershed (Peru) using the MORINGA processing chain. The methods involved multisource satellite imagery and a random forest model, as well as manual post-treatment. The final map provides important information for environmental management and monitoring and contributes to developing standardized methodologies for accurate LULC mapping. Training Dataset
-

A very high spatial resolution Land Use and Land Cover map was produced for the greater Marino watershed (Peru) using the MORINGA processing chain. The methods involved multisource satellite imagery and a random forest model, as well as manual post-treatment. The final map provides important information for environmental management and monitoring and contributes to developing standardized methodologies for accurate LULC mapping. Classification 2019 – Level 3
-

"Irstea a développé une méthode efficace pour détecter les coupes rases en forêt à partir d’images satellites. A la disposition des services de l’État : des images, un guide méthodologique, une formation labellisée, un traitement automatisé et bientôt un service web de calcul à distance et un forum d’échanges.Les services de l’Etat sont chargés de vérifier, sur le terrain, que les déclarations de coupes rases des gestionnaires de forêt privée soumises à une réglementation sont respectées. Il s'agit d'un travail de terrain fastidieux, réalisé sur environ 75 % des 16 millions d'hectares de forêt française métropolitaine, avec des résultats imparfaits. Depuis 2011, à la demande du ministère de l’Agriculture, Irstea a développé une méthode cartographique pour détecter les coupes rases à partir d’images satellitaires. Testée sur deux sylvoécorégions1, en Rhônes-Alpes et Bourgogne, elle est désormais opérationnelle via un logiciel libre, dont la prise en main est décrite dans un guide. Environ 30 agents de Directions Régionales de l’Alimentation, de l’Agriculture et de la Forêt (DRAAF) et Directions Départementales des Territoires (DDT) ont déjà été formés (formation labellisée).Les images de 2 années différentes sont analysées par un algorithme de traitement d’images : elles sont converties en valeurs d’indice de végétation pour détecter et classifier les changements interannuels et en extraire les coupes rases. Les agents de l’Etat sont ainsi plus efficaces - 90 % de bonne détection selon les premiers retours - et plus exhaustifs que dans leurs contrôles sur le terrain. Irstea développe par ailleurs un service web en ligne pour effectuer le traitement des données sur des clusters de calcul distants. Un pas de plus vers la simplification pour les services de l’Etat intéressés.Des portails de téléchargement d’images Cette application préfigure l'exploitation des images satellitaires au service de la gestion et de l'aménagement du territoire qu'Irstea et ses partenaires mettent en place depuis la fin des années 2000 avec le projet GEOSUD, renforcé par un Equipex2 en 2011 et plus largement grâce au consortium Theia qui réunit 11 organismes nationaux depuis 2013. Des portails simplifiés ont été développés permettant à tout acteur public d’accéder gratuitement à différents types d’images, comme par exemple la couverture annuelle du territoire national (y compris dans les territoires d’outre-mer) avec des images haute résolution (1,5 à 6 m). Depuis 2015, des images du monde entier sont accessibles sur commande grâce au contrat de télémesure et à la station de réception directe GEOSUD de Montpellier. Les DRAAF et DDT téléchargent de plus en plus d’images via ces portails pour la détection des coupes rases. La méthode exploitera bientôt les images Sentinel à 10 m dont l'avantage est la forte répétitivité temporelle. La résolution plus fine de Spot 6-7 permettra de développer de nouvelles applications, comme la détection des éclaircies. Partenaires : Irstea (UMR TETIS), MAAF, DRAAF Rhône-Alpes, DRAAF Bourgogne, Geosud 1Nouveau découpage de la France métropolitaine réalisé en 2009 en zones homogènes en relation avec les facteurs de répartition (altitude, caractéristiques des sols et du climat) et de production des écosystèmes forestiers.2Equipement d’excellence, financé par le programme investissement d’avenir (PIA)"
-

A very high spatial resolution Land Use and Land Cover map was produced for the greater Marino watershed (Peru) using the MORINGA processing chain. The methods involved multisource satellite imagery and a random forest model, as well as manual post-treatment. The final map provides important information for environmental management and monitoring and contributes to developing standardized methodologies for accurate LULC mapping. Classification 2019 – Level 2
-

"Dans le cadre du Centre d’Expertise Scientifique Occupation des Sols de THEIA, l’UMR TETIS (Territoire, Environnement, Télédétection et Information Spatiale) travaille depuis plusieurs années au développement de méthodologies de classification de l’occupation du sol à partir d’imagerie satellitaire adaptées au contexte des paysages et systèmes agricoles du Sud. En effet ces contextes, typiquement dominés par la petite agriculture familiale, sont caractérisés par des spécificités (couverture nuageuse importante, petit parcellaire, fragmentation des paysages et hétérogénéité des pratiques agricoles, faible disponibilité de données de référence) qui limitent les performances des approches méthodologiques faisant l’état de l’art actuel. Cependant, au vu de la croissante disponibilité et accessibilité et qualité de l’offre en imagerie satellitaire, les besoins de production systématique de ce genre de produit dans des enjeux de développement territoriale émergent avec vigueur, et un défi s’impose sur la mise au point de méthodologies et chaînes de traitement automatisées pouvant faire face à la diversité des contextes géographiques et paysagers."
-
A very high spatial resolution Land Use and Land Cover map was produced for the greater Marino watershed (Peru) using the MORINGA processing chain. The methods involved multisource satellite imagery and a random forest model, as well as manual post-treatment. The final map provides important information for environmental management and monitoring and contributes to developing standardized methodologies for accurate LULC mapping. 3 levels are available with the training dataset